
2018 Migration Trends accelerate as more people look to leave Denver, San Francisco, and Los Angeles11/2/2018
As mortgage rates climb, affordability in the most expensive markets has suffered, driving more people to affordable, low-tax inland job centers in states like Florida, Texas and Tennessee.
In the third quarter of 2018 people continued to move away from high-cost coastal markets like San Francisco, New York, Los Angeles and Washington, D.C., in increasing numbers. Meanwhile, more affordable areas like Sacramento, Atlanta and Phoenix continued to draw thousands of potential new residents. The latest migration analysis is based on a sample of more than 1 million Redfin.com users who searched for homes across 80 metro areas from July through September. Nationally, 25 percent of Redfin.com home searchers looked to move to another metro area in the third quarter, compared to 22 percent during the same period last year. Affordability continues to be a driving factor causing people to move away from the coasts. “Rising mortgage rates are exacerbating affordability issues that have been driving people out of expensive coastal metros for the past few years,” said Redfin chief economist Daryl Fairweather. “With rates no longer near historic lows, buyers are increasingly cost-conscious, seeking more affordable homes in low-tax states in the South and middle of the country.” Moving Out – Metros with the Highest Net Outflow of Redfin Users: 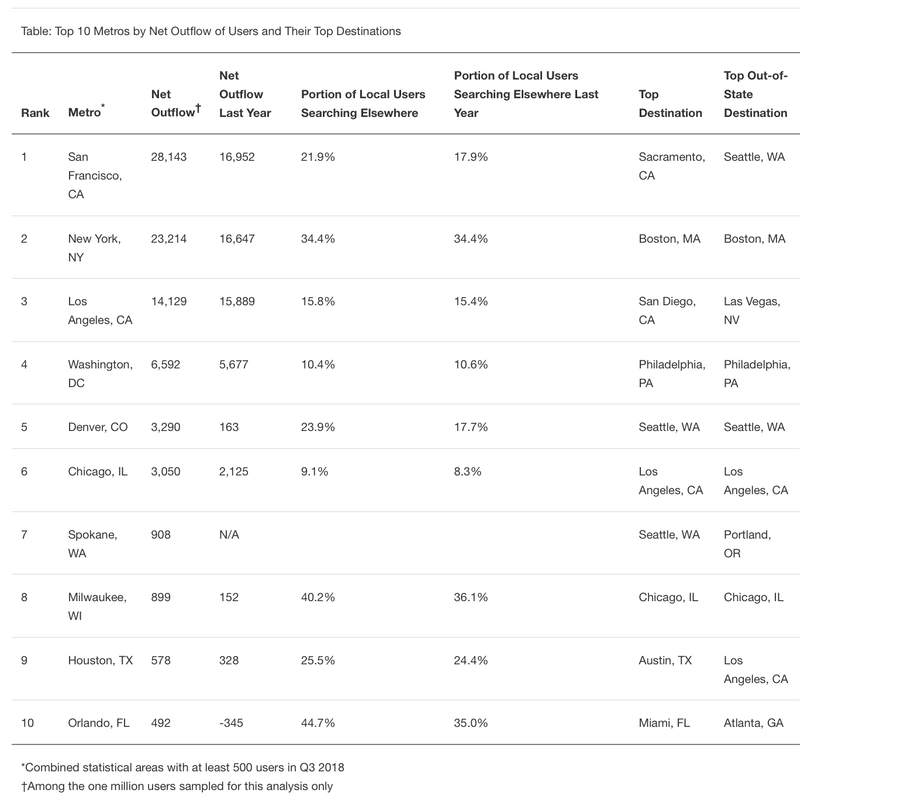
San Francisco, New York, Los Angeles, Washington, D.C. and Denver posted the highest net outflows in the third quarter. Net outflow is defined as the number of people looking to leave the metro minus the number of people looking to move to the metro. A net outflow means there are more people looking to leave than people looking to move in, while a net inflow means more people are looking to move in than leave.
After debuting on the list of top ten metro areas with a net outflow at number seven in the first quarter and moving up to number six in the second quarter, Denver moved up again in the third quarter to pass Chicago at number five. Of all Denverites using Redfin, 24 percent were searching for homes in another metro, up from 17 percent during the same time period a year earlier. Among the Denverites who were searching elsewhere, approximately 23 percent were looking at more affordable metros within the state: Colorado Springs and Fort Collins. A recent New York Times article points out that Denver has suffered from “years of under-building,” and quoted Colorado State University economist Phyllis Resnick as saying that the region’s affordability imbalance may not correct “just through market forces, unless that’s through people moving out.” Of all San Francisco Bay Area residents using Redfin, 22 percent were searching for homes in another metro, up from 18 percent during the same time period a year earlier. Of New Yorkers, 34 percent looked to leave, about the same as last year. Of Los Angelenos, 16 percent looked to leave, compared to 15 percent last year. Moving In – Metros with the Highest Net Inflow of Redfin Users: 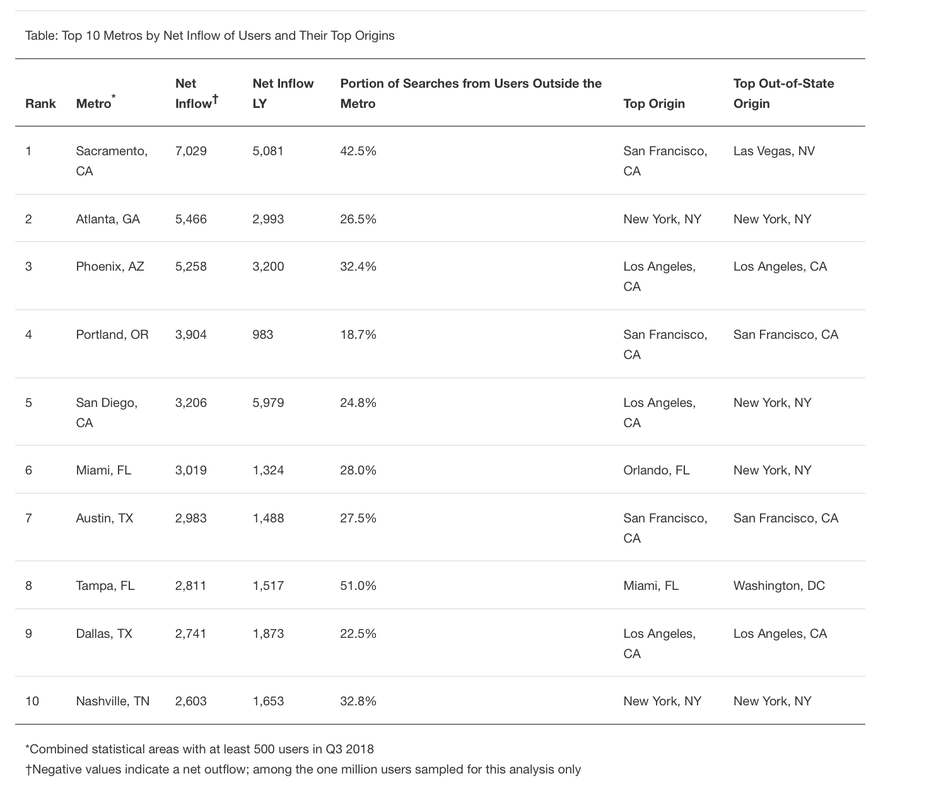
The places attracting the most people are mostly the same regions that have been growing throughout the past year, including Sacramento, Atlanta, Phoenix and Portland. The metro areas seeing the biggest inflows of new residents are the big cities where home prices are still relatively affordable and job markets are strong. Median prices in the metro areas seeing the largest net inflow average around $150,000 below prices in the metro areas with the largest net outflow.
“We talk with a lot of people moving to Atlanta from areas experiencing more of a slowdown, and they seem to think Atlanta is too good to be true,” said Atlanta Redfin agent Ashley Ward. “Benefits of Atlanta that keep drawing people here include top-notch public education, affordable housing, an appreciating market and more job opportunities.”
Methodology
Redfin analyzed a sample of more than 1 million Redfin.com users searching for homes across 75 metro areas from July through September 2018. Users must have viewed at least 10 listings during the quarter. We also excluded locations that in aggregate represented less than 20 percent of a user’s searches. We determined the home metro by mapping the user’s IP address of the most common location they searched from. If a user was searching in more than one metro, we accounted for the share of searches in each metro. Combined Statistical Areas (as defined here) must have had at least 500 users either searching from or in that metro during the quarter. To calculate net inflow and outflow, we take the number of users looking to leave the metro area and subtract the number of users looking to move to the metro area from another metro area. For example, let’s say there are 3,000 people in Phoenix looking at homes outside of Phoenix. 10,000 people outside of Phoenix are looking at homes in Phoenix. More people are moving to Phoenix than moving away, giving Phoenix has a net inflow of 7,000. (10,000 – 3,000 = 7,000) It’s worth noting that net inflow and outflow data does not account for Redfin’s market share or the population of metro areas. In metros where Redfin has a larger number of website visitors, we may have a higher volume of inbound and outbound searches than in metros that are smaller or where Redfin has a smaller user base. The U.S. Census Bureau measures net migration flows, which is a common practice when analyzing migratory patterns. 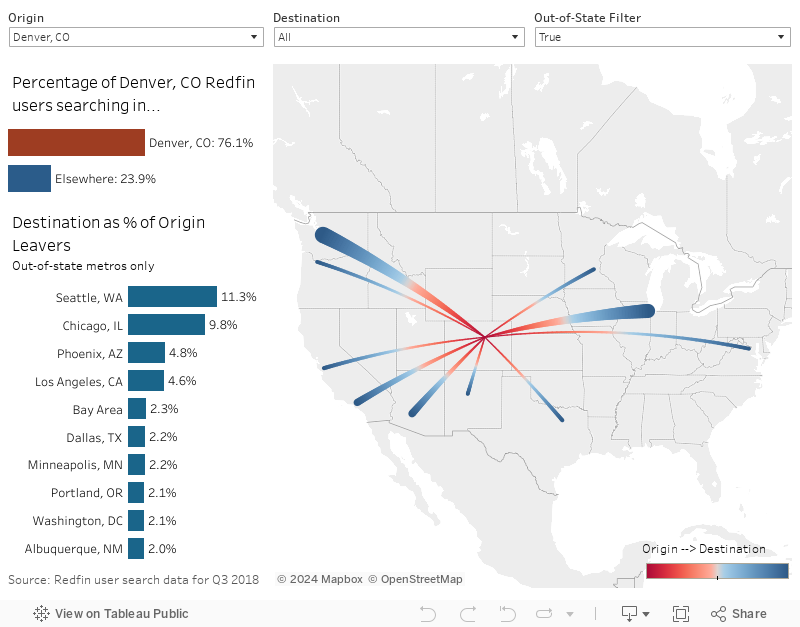
0 Comments
Leave a Reply. |
 RSS Feed
